How I Debug Production Issues Without Guessing
Production bugs rarely arrive with a useful stack trace. This is the repeatable workflow I use to turn a vague report into a confident fix.
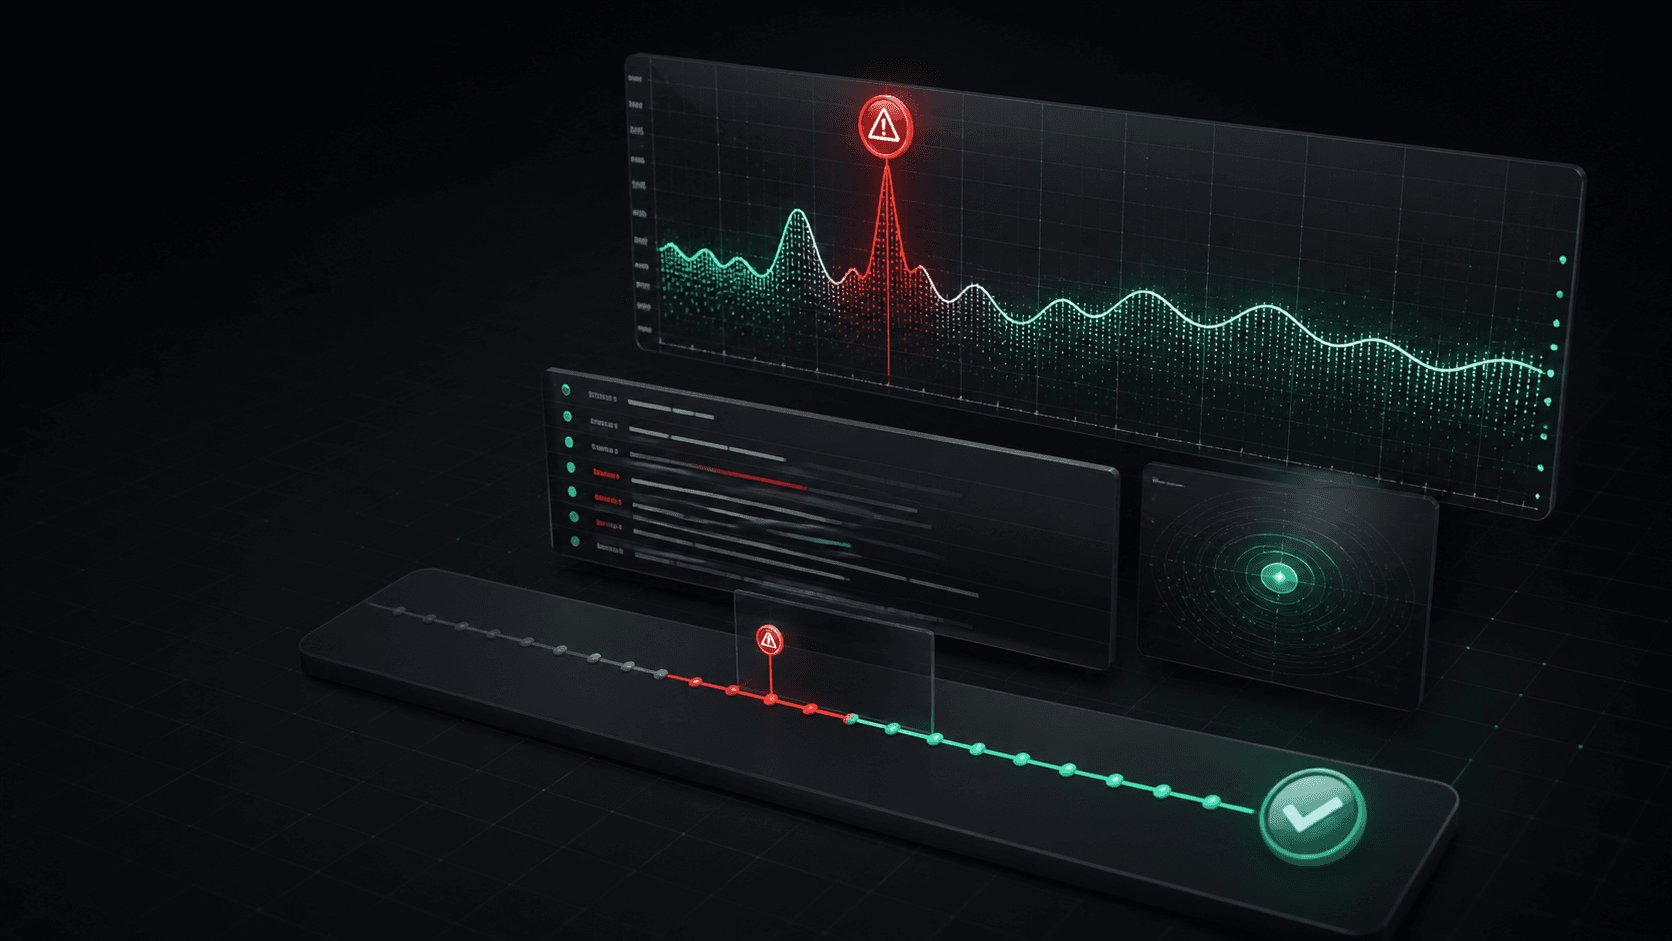
Debug the evidence, not the hunch
A report such as “the app is slow” is a starting point, not a diagnosis. The goal is to connect a user-visible symptom to evidence: a request, an error, a dependency, or a recent change.
That means collecting three signals together: logs explain what happened, metrics show how widespread it is, and traces show where the time went.
Start with the blast radius
Before changing code, establish what is actually affected:
- Which route, job, customer segment, or region is failing?
- When did the behaviour begin, and did it follow a deploy?
- Is it an elevated error rate, latency, or a complete outage?
Make logs easy to join
Plain text logs are hard to search under pressure. I prefer structured logs with a request ID that travels through every service call.
logger.error({
  requestId,
  userId: session.user.id,
  route: "/api/checkout",
  error: error.message,
}, "Checkout failed");
With the same requestId in application logs, worker logs, and upstream calls, one failed request becomes a complete story instead of a pile of guesses.
Use metrics to find the pattern
Metrics tell me whether an incident is isolated or systemic. The first dashboard I check covers:
- Request rate, error rate, and p95 latency per route
- CPU, memory, and container restarts
- Database latency, connection pool usage, and slow queries
- Queue depth and job failure rate, where background work is involved
Focus on trends rather than a single number. A p95 latency spike that begins exactly after a release is a much stronger clue than a high CPU reading alone.
Trace the slow request
When a request crosses the application, database, and third-party APIs, distributed tracing reveals the critical path. I look for the longest span first, then compare a slow trace with a healthy one.
- Find a representative slow or failed request.
- Identify the span responsible for most of the duration.
- Inspect its query, dependency response, retries, and context.
- Confirm the hypothesis with logs and metrics before fixing it.
Leave the system better than you found it
The fix is only half the outcome. After an incident, I add the signal that would have made the next diagnosis faster: a targeted alert, a missing metric, clearer log context, or a health check with a meaningful dependency probe.
Confidence comes from visibility
Observability is not a dashboard collection. It is the ability to ask a useful question of a running system and get enough evidence to act. Good logs, metrics, and traces turn production debugging from stressful improvisation into a disciplined engineering practice.